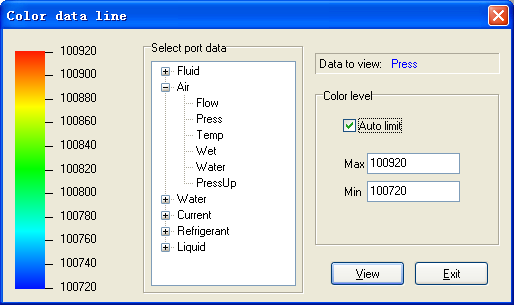
Color level data line is used to express the size of parameter value, and illustrate how one parameter distributes at each network node.
Sample
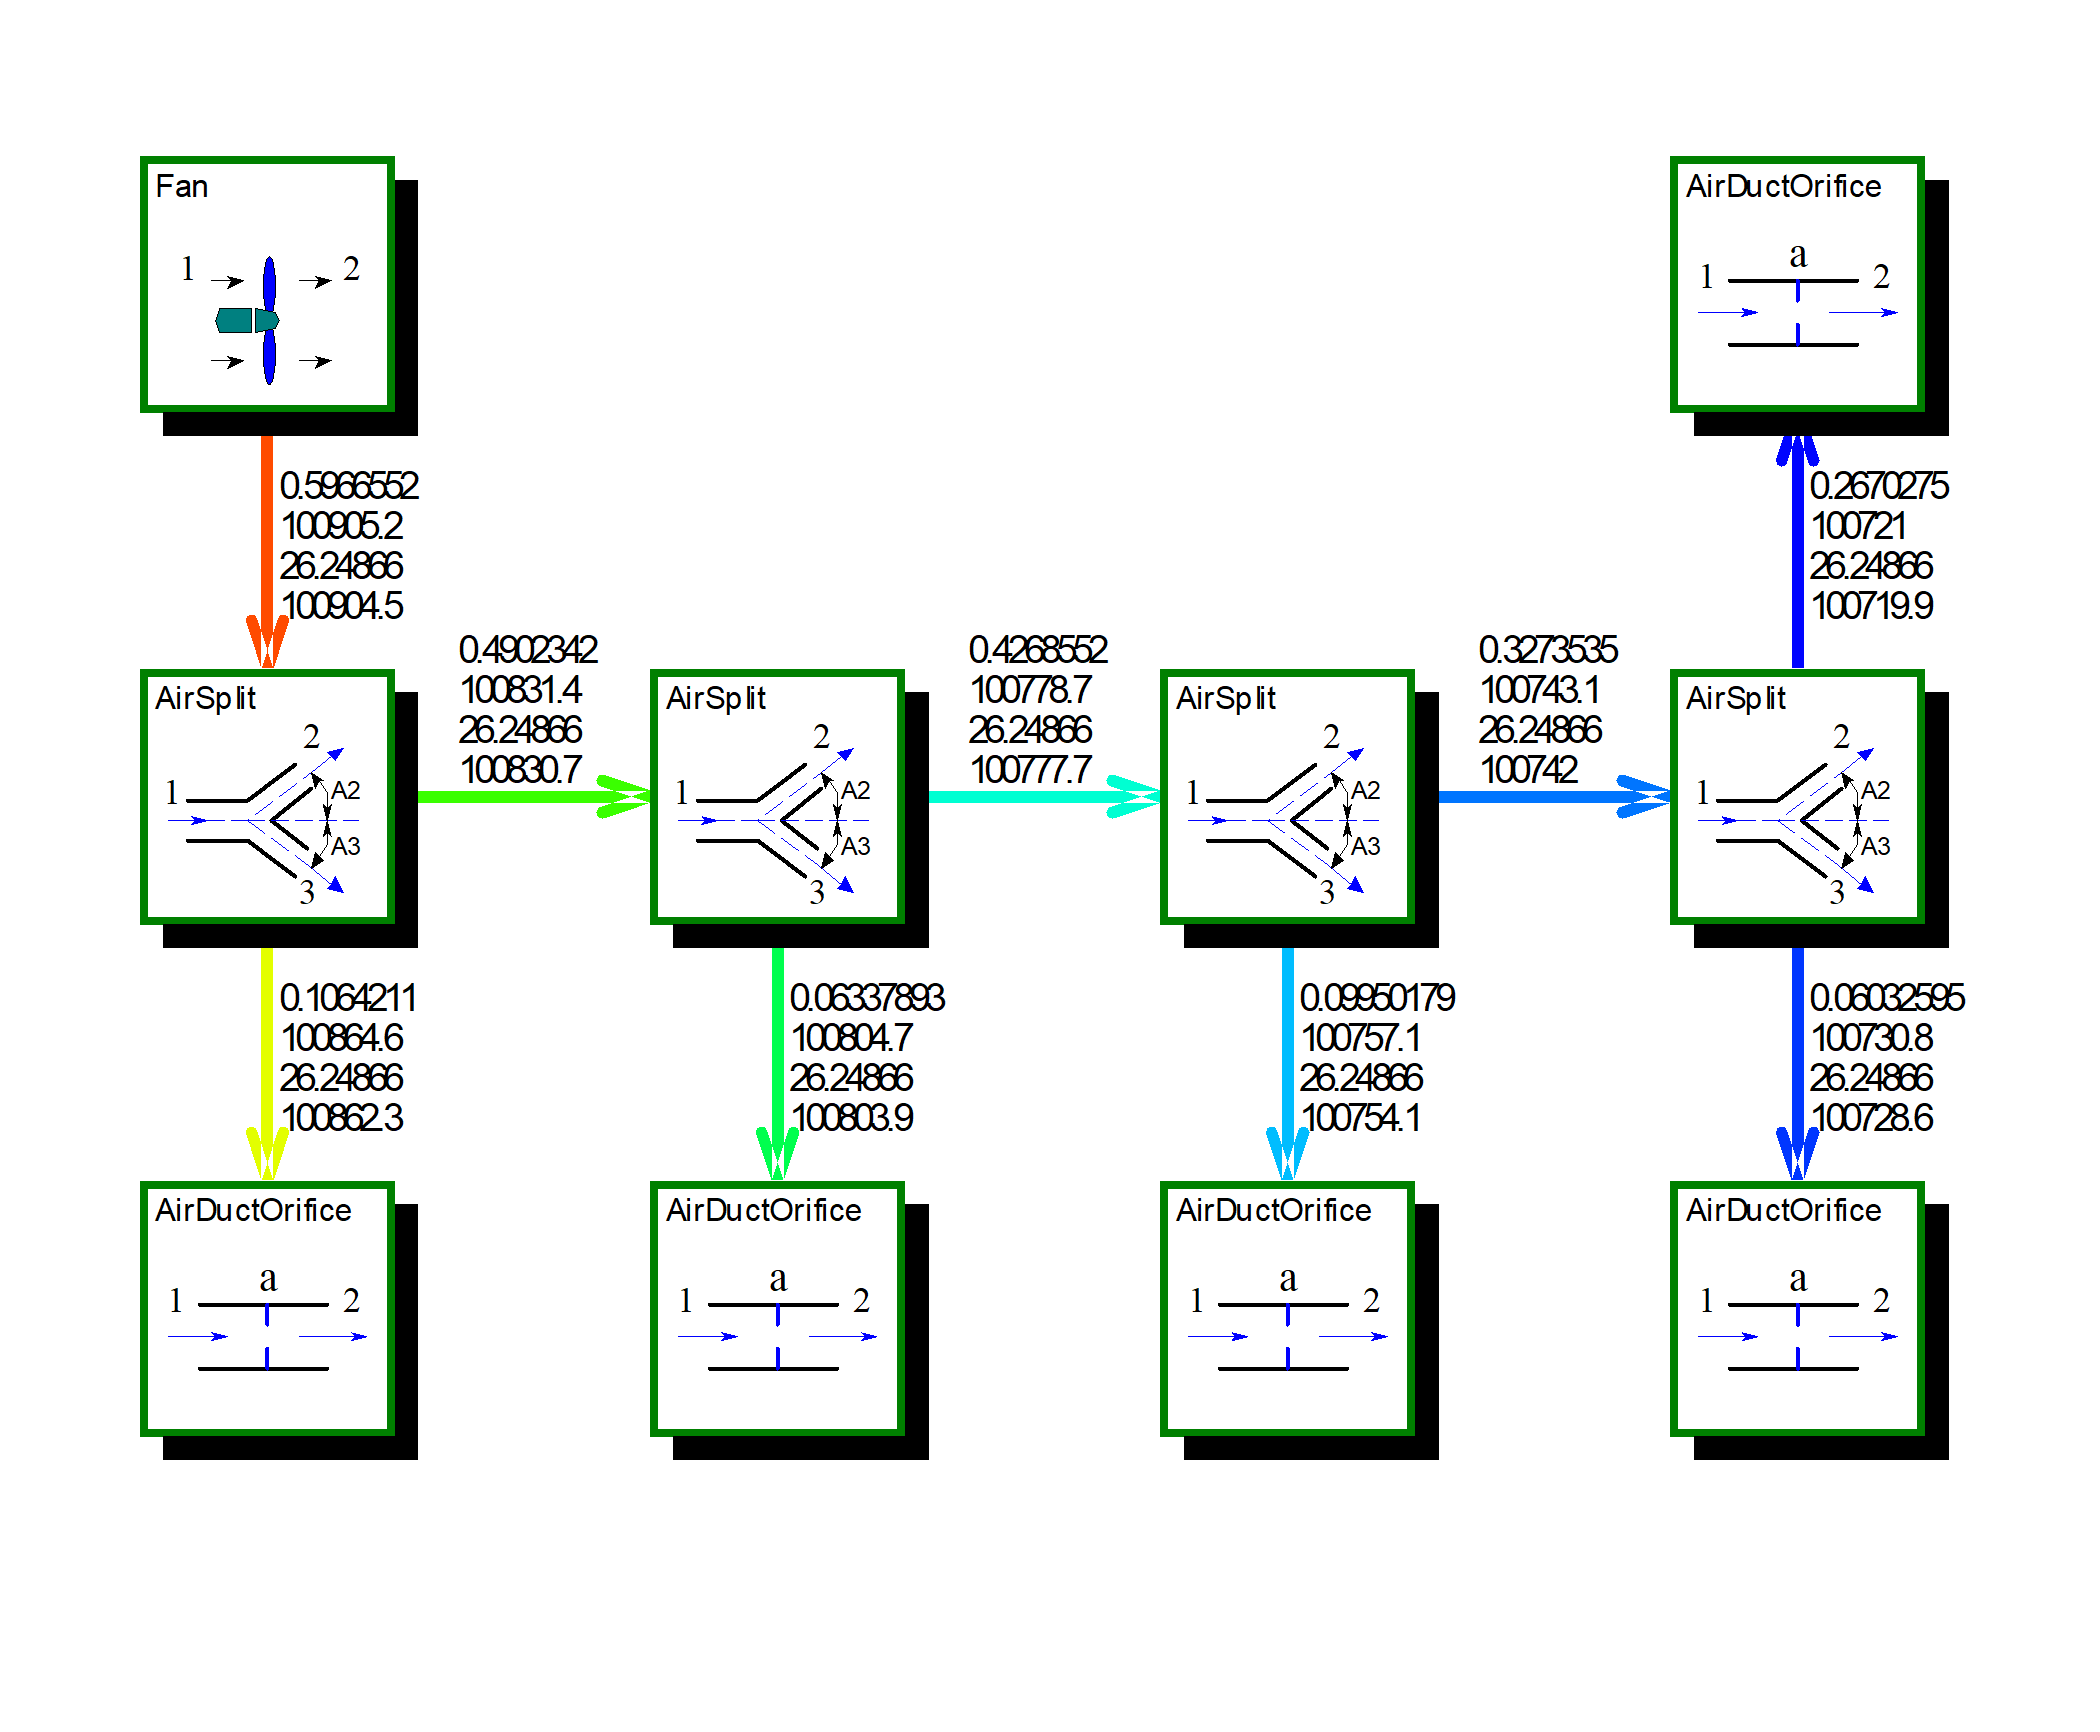
Use color level to show duct network pressure
Open the project file created in chapter of "Static system simulation", run calculation till the process finished.
Select "View -> Color level data", the color level data line setup dialog shows:

Select "Air -> Press", then the item is added to the "Data to view" area. Note this means all parameter items of ports with same name will be tranlated to color level.
Check the option "Auto range", so that to calculate data range automatically, Then press "Select", the color of connection lines in model window will change, as the follow image shows:

A FlyCarpet package is a collection of components. A FlyCarpet project can include multiple same state components.
-
Math
General state, mathematical and logical functions.
-
General
Dynamic state, general components for dynamic simulation.
-
Interactive
Dynamic state, interactive components for dynamic simulation.
-
DuctNet
Static state, duct network calculation.
-
Refrigeration
Static state, refrigeration system design and optimization.
-
ECSOptim
Static state, airplane Environmental Control System(ECS, or A/C system) design and optimization.
-
HXFinPlate
Static state, Fin-Plate style heat exchangers design and simulation.
-
VacuumDesign
Static state, steam eject steel furnace vacuum pump design and optimization.
These tools are used to reduce developing time for package and its components so that developers can focus on the core component logic design.
-
FCPBuilder
A fast package and components c++ code generating tool based on inputs, outputs settings and logic processing code.
-
MetaBuilder
A specific metafile builder for FlyCarpet component.